Building a Self-Healing k3s Homelab (Part 5): RCU Stalls, Watchdogs, and Actually Healing
Part 4 covered the containerd sandbox leak problem and the ExecStartPre fix. The sandbox leaks were solved. But there was still an underlying issue that kept forcing those hard reboots in the first place.
This is Part 5: the kernel RCU stall problem, why it’s dangerous on a Raspberry Pi running k3s, the mitigations I layered on, and the moment the cluster finally handled an outage without me.
What Is an RCU Stall?
RCU stands for Read-Copy-Update. It’s a synchronization mechanism built into the Linux kernel for situations where reads are very frequent and writes are rare. The basic idea: readers don’t take locks. Writers make a copy of the data, update it, and wait until all current readers are done before pointing the system at the new copy. The period readers are finishing up is called a “grace period.”
RCU is used everywhere in the kernel: memory management, networking, filesystem layers, scheduling. When something goes wrong in a grace period, when a reader holds an RCU read-side critical section open far longer than expected, the kernel logs:
rcu: INFO: rcu_preempt detected expedited stalls on CPUs/tasks: { P<pid> } 21 jiffies
This is the kernel saying: “something is blocking an RCU grace period, and I’ve been waiting 21 scheduler ticks for it to release.” Usually this resolves in a few milliseconds. Occasionally it doesn’t.
The Raspberry Pi kernel issue: The 6.17.0-1008-raspi kernel (Ubuntu 25.10 for Raspberry Pi) has a bug where RCU expedited stalls are triggered during runc:[2:INIT] container initialization, specifically when Flannel creates virtual ethernet pairs (veth). Every container start on a Jarvis pod goes through this path:
container start → runc → fork runc:[2:INIT] → Flannel creates veth pair → RCU stall
The stalls are normally brief (21-22 jiffies ≈ 200ms) and the system recovers. The kernel can have dozens of these per hour and still run fine.
The problem is what happens when they accumulate.
How Stalls Kill the Node
Individual RCU stalls are survivable. A rate of 0-5 per 10 minutes is normal background noise on this cluster. But under certain conditions the rate climbs, and once it climbs past a threshold the failure mode is dramatic.
The “network black-hole” failure mode:
When the RCU stall rate becomes high enough for long enough, the kernel’s softirq processing path (interrupt-driven network packet handling) stops making forward progress. The CPU is too busy trying to resolve RCU grace periods to process incoming network packets.
From the outside, the node looks dead: no ping response, no SSH, no API server connections, nothing. From the inside, the kernel is still running: etcd compacts, cron fires, journald writes. The hardware watchdog might not trigger because the kernel is technically alive. The kernel just isn’t servicing the network stack.
This is different from an OOM kill (there’s no crash, no dmesg panic) and different from a D-state hang (there’s no single stuck process). It’s an emergent network blackout from aggregate CPU pressure on the interrupt path. I called it a “network black-hole” because that’s what it looks like from the outside.
Evidence from the November 30 outage:
13:31 MDT: First RCU stall of the day
13:31–16:04 MDT: Stalls fire every 2-4 minutes (avg 1.4/10min)
13:59:43: Longhorn admission webhook: context deadline exceeded
13:59:53: remotedialer: i/o timeout — Ultron loses link to Jarvis API
14:04:49: k3s taint-eviction-controller deletes ALL Ultron pods simultaneously
14:14:45: Mass "client disconnected" — all watchers lose streams
And throughout all of this, from Jarvis’s perspective:
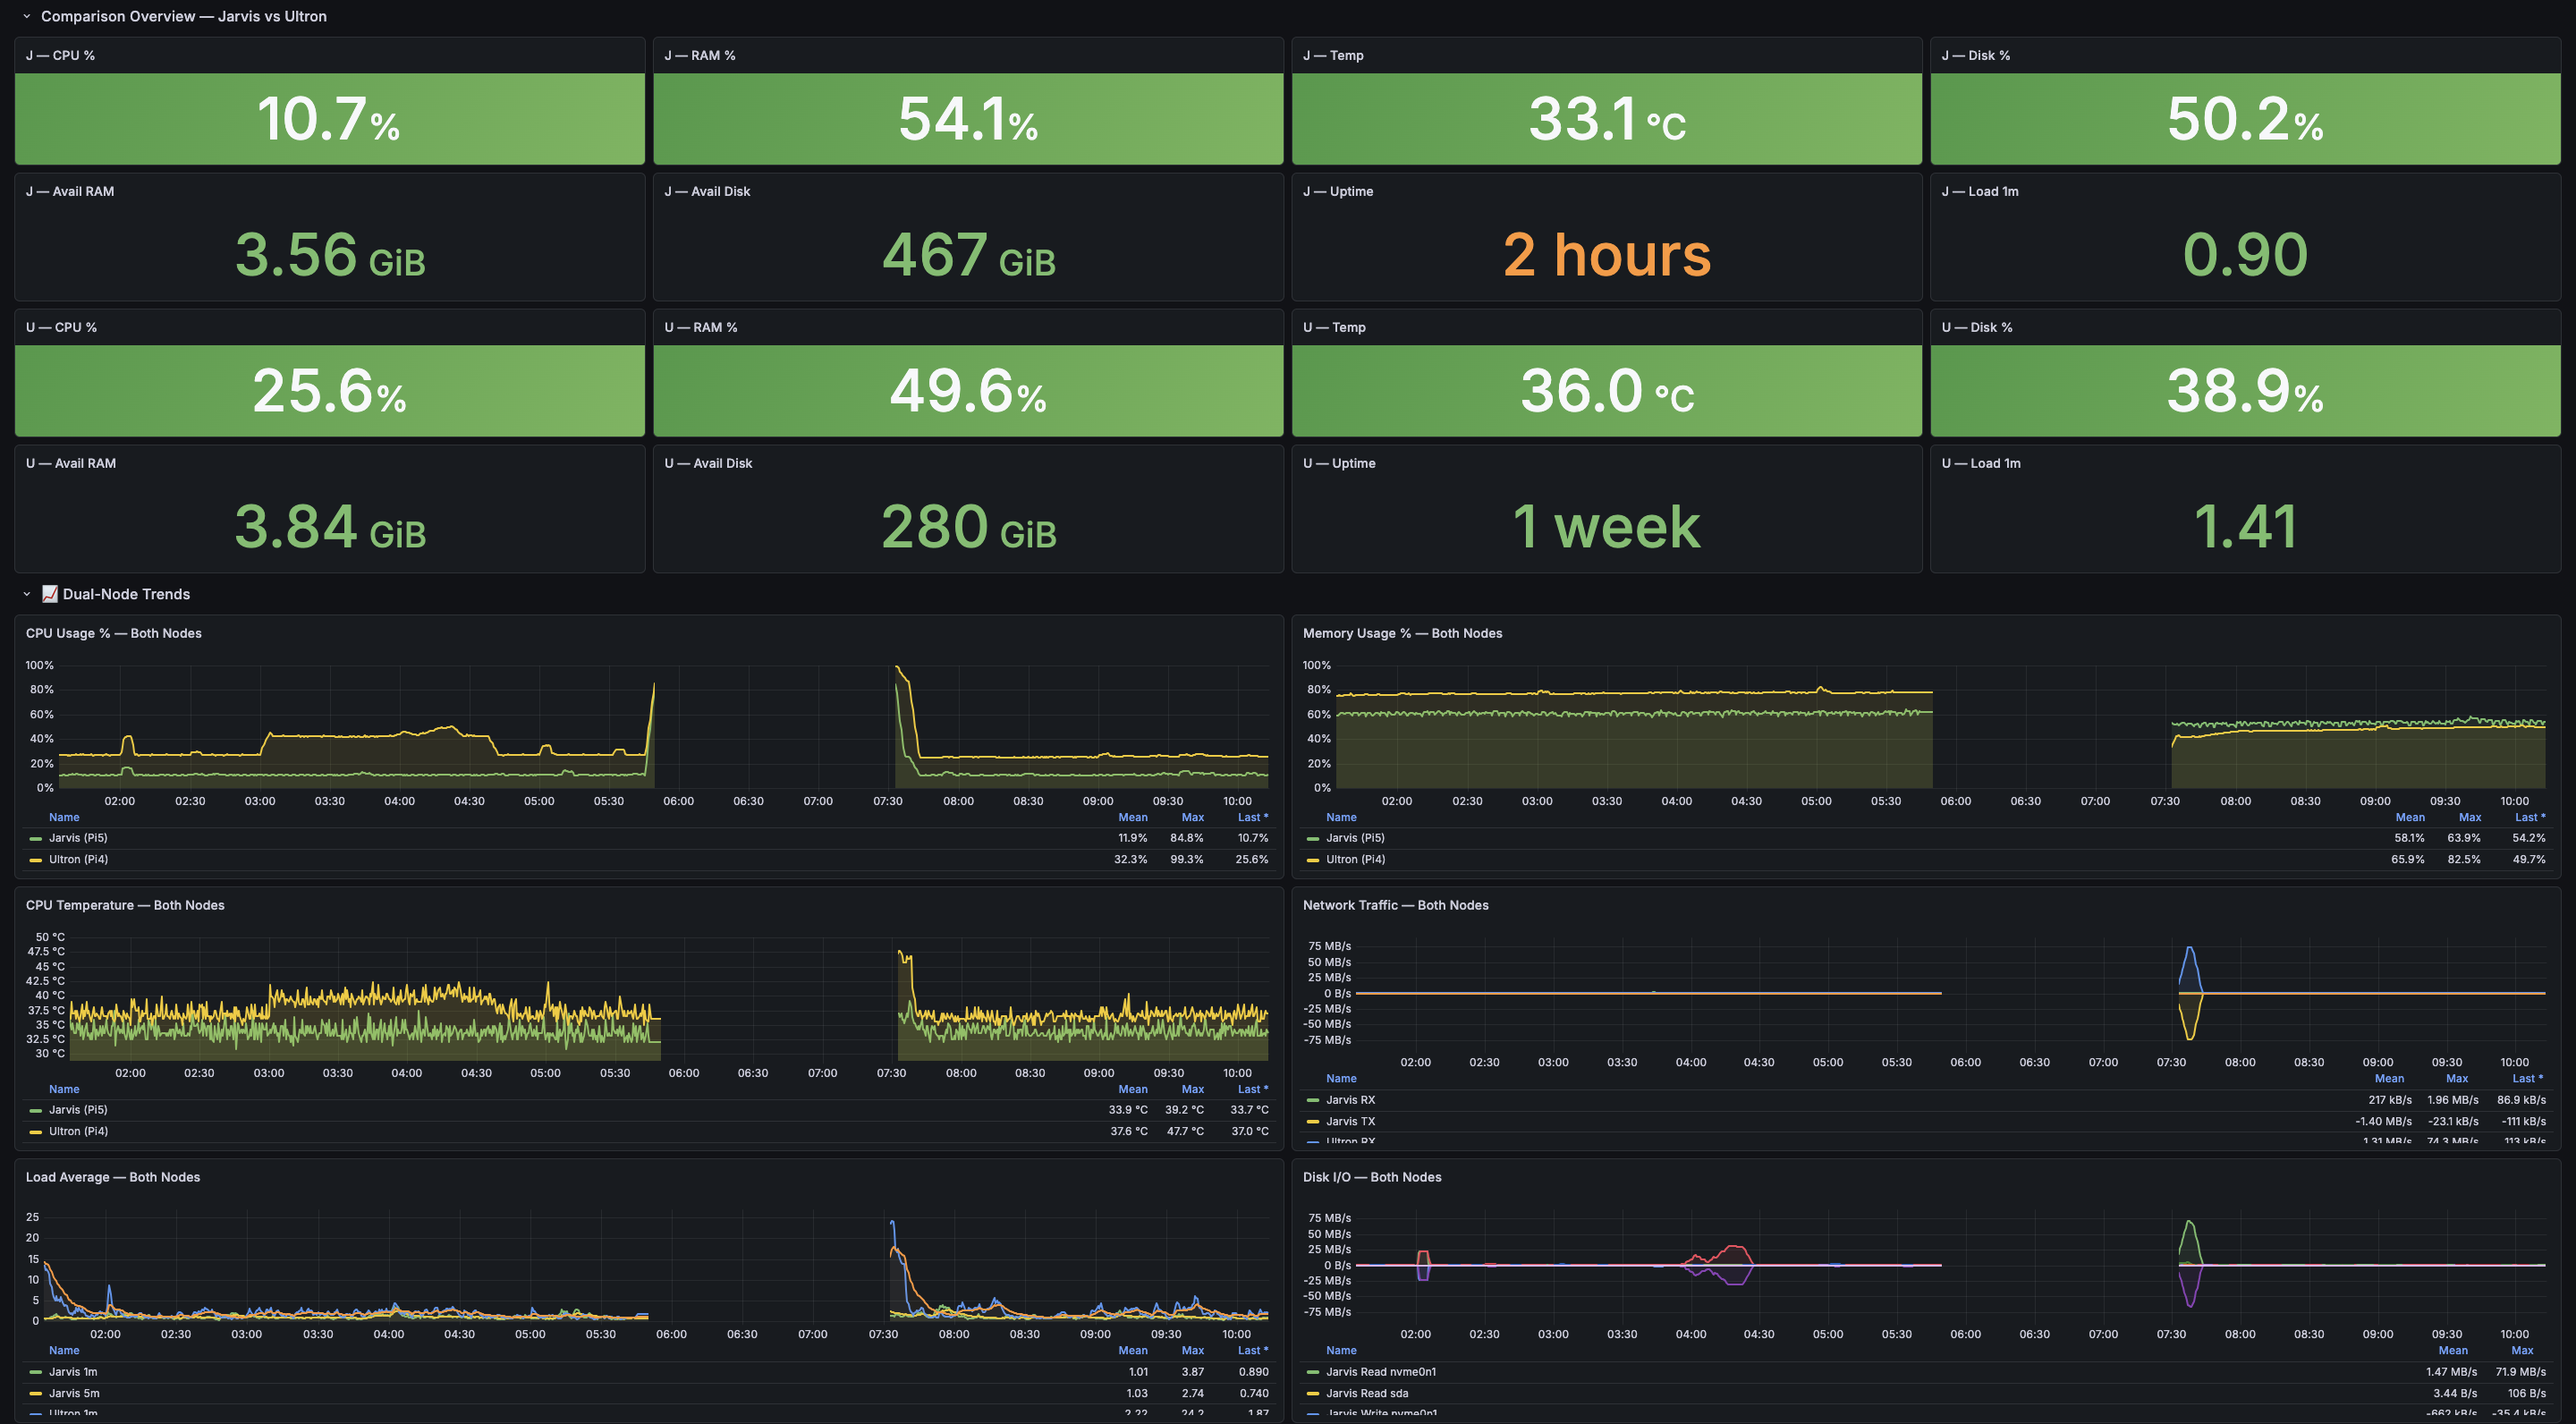
- CPU: ~12% (not saturated)
- RAM: 56% (not under pressure)
- etcd: compacting every 5 minutes (still working)
- journald: still writing
The node was alive. It just couldn’t talk to anyone.
flowchart LR
    subgraph NETWORK[Network Path - FAILING]
        NIC[NIC hardware interrupts]
        SOFTIRQ[softirq handlers\nnet_rx_action]
        TCP[TCP stack]
    end
    subgraph KERNEL[Kernel - RUNNING]
        SCHED[Scheduler]
        RCU[RCU subsystem\nstalled]
        ETCD[etcd\nstill compacting]
        JOURNALD[journald\nstill writing]
    end
    subgraph OUTSIDE[External - DEAD]
        SSH[SSH connections blocked]
        API[k3s API blocked]
        PING[ICMP blocked]
    end

    RCU -->|saturates CPU cycles| SOFTIRQ
    SOFTIRQ -.->|cannot process| NIC
    NIC -.->|packets dropped| OUTSIDE

    SCHED --> ETCD
    SCHED --> JOURNALD
The Conditions That Amplify Stalls
Not every workload configuration produces this. The following conditions make it worse:
Container churn. Every container lifecycle event (create, start, stop, delete) goes through runc:[2:INIT] and veth pair creation. A normal cluster lifecycle produces some of this, but crash-looping pods (as in Part 4) produce it at extreme rates. Eight crash-looping CSI pods means ~4 container events per second, sustained.
Prometheus TSDB compaction. Under load, Prometheus compaction runs burn through CPU cycles. This raises the background pressure on the kernel scheduler, reducing its ability to absorb RCU stall handling.
Unthrottled rsync over SSH. Before I added --bwlimit=5000 to the backup job, rsync over a gigabit link fully utilized Jarvis’s I/O and network stack. This produced an interrupt storm that generated RCU stalls equivalent to a full crash.
The November 13 outage was specifically caused by unthrottled rsync: the backup job at 02:30 MST pushed the CPU from ~20% to ~85% and triggered continuous RCU stalls that froze the node in under 2 seconds.
Layer 1: hung_task_panic
This was the first mitigation (applied after the November 2 outage):
kernel.hung_task_timeout_secs = 120
kernel.hung_task_panic = 1
If any kernel task stays in D-state (uninterruptible sleep) for 120+ seconds, the kernel panics and reboots automatically (via the panic=10 boot cmdline parameter k3s sets by default).
This works for the NFS case: hard NFS mounts create D-state threads. After 2 minutes, panic, automatic reboot. No physical intervention needed.
It does NOT work for the “network black-hole” case. RCU stalls produce network layer saturation, not D-state tasks. Individual tasks return from NFS operations (with EIO), so no single task exceeds the 120-second threshold. The system looks fine at the task level while being functionally dead at the network level.
Layer 2: Hardware Watchdog (systemd)
The Raspberry Pi BCM2835/ BCM2711 has a hardware watchdog: a timer that resets the board if the kernel doesn’t “pet” it (reset the timer) within the configured window.
The k3s default configuration doesn’t enable the watchdog. I added it via systemd:
# /etc/systemd/system.conf.d/watchdog.conf
[Manager]
RuntimeWatchdogSec=30
RebootWatchdogSec=10min
WatchdogDevice=/dev/watchdog
With this, systemd pets the hardware watchdog every 30 seconds. If systemd can’t run (kernel panic, hard lock, etc.), the watchdog fires and the board resets.
This also doesn’t catch the network black-hole. In that failure mode, the kernel is running fine. Systemd is running fine. The watchdog gets petted every 30 seconds. No reset. The node just silently stops serving traffic until someone pushes the power button.
Layer 3: Prometheus Alerts for Reboot Events
After the November 22 outage I added PrometheusRule resources to alert on reboot events:
# NodeUnexpectedReboot: fires within 10 min of any unexpected reboot
- alert: NodeUnexpectedReboot
  expr: |
    (node_time_seconds - node_boot_time_seconds < 600)
    and
    (node_time_seconds - node_boot_time_seconds offset 5m > 600)
  for: 0m
  labels:
    severity: critical
  annotations:
    summary: "Unexpected reboot detected on {{ $labels.instance }}"

# NodeRepeatedReboots: >1 reboot in 24h
- alert: NodeRepeatedReboots
  expr: changes(node_boot_time_seconds[24h]) > 1
  for: 0m
  labels:
    severity: warning
These would have fired immediately after any of the hard resets, giving an Alertmanager notification instead of relying on me noticing the Home Assistant tile was grey.
Detection, not healing. Useful but not the goal.
Layer 4: The RCU Stall Watchdog
This is the one that actually made a difference.
After analyzing the November 30 outage logs, I had the RCU stall rate data I needed:
| Phase | Stall rate | Notes |
|---|---|---|
| Boot burst (first 60s) | ~55 stalls in 1 min | Normal — CNI initialization, containerd pulling state |
| Stable operation | 0-2 per 10 min | Background noise level |
| Pre-blackout cascade | avg 1.4/10min, peaks at 3/10min | Degrading toward blackout |
| Post-hard-reboot noise | avg 3.9/10min, peaks at 8/10min | Boot-time burst, not a crisis |
The idea: issue a controlled systemctl reboot before the network stack goes dark. A clean reboot takes ~2 minutes. A network black-hole can last 2 hours or more (the November 30 blackout lasted from 13:59 to 16:10, over 2 hours of dead services).
The first version of the script used a single threshold: 3 stalls in a 10-minute window. It worked the same day it was deployed (more on that below). But the threshold was too sensitive. In early April, a DHCP race condition on boot generated a brief stall storm (75 stalls in 2.5 minutes, all in the first seconds of boot). The watchdog woke up at t=15min, saw 3+ stalls still in its 10-minute lookback window, and rebooted. Which triggered another DHCP race. Which triggered another reboot. Jarvis rebooted 10 times in 3 hours before I caught it.
That led to a second version: threshold raised to 10, lookback extended to 15 minutes, grace period to 20 minutes. The DHCP race was separately fixed with static IPs, but the higher threshold was correct anyway. Three stalls in 10 minutes is normal I/O noise; it’s not a cascade.
Then the April 5 dual-cascade incident broke the single-path model entirely: Event 1 was a slow build (10 stalls/30min) that the watchdog caught cleanly. Event 2 was a burst (30 stalls in 60 seconds) that froze the kernel between watchdog checks. The network stack died in the ~60-second window between the last watchdog run and the next one.
The current version has two detection paths:
- Path A (burst): 10+ stalls in 2 minutes. Catches the fast cascades that freeze the kernel in under a minute.
- Path B (sustained): 10+ stalls in 15 minutes. Catches the slow-build pattern from the original November 30 and March 31 outages.
Timer interval dropped from 5 minutes to 2 minutes, AccuracySec from 30s to 10s.
Current script deployed to Jarvis as /usr/local/bin/rcu-stall-watchdog.sh:
#!/bin/bash
# Dual-path RCU stall detection (v3, April 2026)
# Path A: burst — catches fast cascades (30 stalls/60s pattern)
# Path B: sustained — catches slow builds (1-2 stalls/min for 15+ min)

BURST_LOOKBACK_MIN=2
BURST_THRESHOLD=10
SUSTAINED_LOOKBACK_MIN=15
SUSTAINED_THRESHOLD=10
GRACE_MIN=20

uptime_seconds=$(awk '{print int($1)}' /proc/uptime)
uptime_minutes=$(( uptime_seconds / 60 ))

if [[ "$uptime_minutes" -lt "$GRACE_MIN" ]]; then
    logger -p kern.info -t rcu-stall-watchdog \
        "uptime=${uptime_minutes}min — skipping (grace period ${GRACE_MIN}min)"
    exit 0
fi

burst_count=$(journalctl -k --since "${BURST_LOOKBACK_MIN} minutes ago" --no-pager -q 2>/dev/null \
    | grep -c "rcu_preempt detected expedited stalls" || true)

sustained_count=$(journalctl -k --since "${SUSTAINED_LOOKBACK_MIN} minutes ago" --no-pager -q 2>/dev/null \
    | grep -c "rcu_preempt detected expedited stalls" || true)

logger -p kern.info -t rcu-stall-watchdog \
    "uptime=${uptime_minutes}min burst_${BURST_LOOKBACK_MIN}min=${burst_count} sustained_${SUSTAINED_LOOKBACK_MIN}min=${sustained_count}"

if [[ "$burst_count" -ge "$BURST_THRESHOLD" ]]; then
    logger -p kern.crit -t rcu-stall-watchdog \
        "CRITICAL: ${burst_count} stalls in ${BURST_LOOKBACK_MIN}min (path A burst). Rebooting."
    systemctl reboot
elif [[ "$sustained_count" -ge "$SUSTAINED_THRESHOLD" ]]; then
    logger -p kern.crit -t rcu-stall-watchdog \
        "CRITICAL: ${sustained_count} stalls in ${SUSTAINED_LOOKBACK_MIN}min (path B sustained). Rebooting."
    systemctl reboot
fi
Systemd timer:
# /etc/systemd/system/rcu-stall-watchdog.timer
[Timer]
OnBootSec=20min
OnUnitActiveSec=2min
AccuracySec=10s

[Install]
WantedBy=timers.target
The 20-minute OnBootSec aligns with GRACE_MIN=20. During the first 20 minutes after boot, even if stall rates are high (they always are during CNI initialization), the watchdog takes no action.
The three threshold iterations, in hindsight:
| Version | Date | Threshold | Lookback | Paths | Timer | What broke it |
|---|---|---|---|---|---|---|
| v1 | Nov 30 | 3 | 10min | 1 | 5min | DHCP race: 10 reboots in 3 hours |
| v2 | Apr 3 | 10 | 15min | 1 | 5min | Apr 5 burst: 30 stalls/60s froze kernel between checks |
| v3 | Apr 5 | 10 burst / 10 sustained | 2min / 15min | 2 | 2min | Current |
The First Real-World Trigger
November 30, 2025. Same day the watchdog was deployed.
The cluster went through the network black-hole failure at 13:59-16:10 MDT (the last manual outage). I power-cycled, investigated, deployed the watchdog, and went on with my day.
At 17:50:44 MDT:
Nov 30 17:50:44 Jarvis rcu-stall-watchdog[...]: CRITICAL: 7 stalls in last 10 min
  (threshold=3, uptime=95min). Initiating controlled reboot.
The RCU stall cascade was building again. Seven stalls in 10 minutes. The v1 watchdog caught it.
At 17:52:41 MDT, Jarvis was back online.
2 minutes. Compared to 2+ hours of dead services from the morning’s manual incident.
Nodes Ready, all 11 ArgoCD apps Synced/Healthy within 5 minutes of the watchdog reboot.
This was the moment I knew the approach was sound. The thresholds would need tuning (and they did, twice), but the core idea of “detect the cascade, reboot before the network dies” was proven.
flowchart LR
    subgraph MANUAL["Manual Outage (2+ hrs)"]
        A["13:31 RCU stalls begin"] --> B["13:59 Network blackout"]
        B --> C["14:04 Ultron pods evicted"]
        C --> D["14:14 All watchers disconnect"]
        D --> E["16:10 Manual power cycle"]
    end
    subgraph AUTO["Watchdog Recovery (2 min)"]
        F["17:31 RCU stalls resume"] --> G["17:50 Watchdog detects 7 stalls"]
        G --> H["17:50 Controlled reboot"]
        H --> I["17:52 Jarvis back online"]
    end
    E --> F

    style E fill:#c00,color:#fff
    style I fill:#0a0,color:#fff
Layer 5: rcupdate.rcu_normal=1 – Attacking the Root Cause
All the layers so far are reactive: detect the problem, reboot before it kills the network. The watchdog works, but every reboot is still 2 minutes of downtime. The real question was whether I could stop the stalls from happening in the first place.
The 6.17.x-raspi kernel generates RCU stalls during synchronize_rcu_expedited() calls. These are triggered by containerd/k3s when Flannel creates virtual ethernet pairs (veth) during container initialization. The expedited path forces a synchronous, CPU-interrupting grace period. On the Pi 5’s ARM SoC under container I/O pressure, this stalls.
The first attempt was rcupdate.rcu_expedited=0, added to the boot cmdline.txt on April 5. This disables the kernel’s auto-promotion of normal synchronize_rcu() calls to the expedited path. It stopped the fast cascades (the kind that used to produce 30 stalls in 60 seconds), but it didn’t block direct synchronize_rcu_expedited() calls from containerd’s CNI code path.
Evidence from the April 6-8 boot: 726 RCU expedited stalls logged over 30.5 hours. That’s 1 stall every 2.5 minutes, sustained. Not fast enough to trip the burst threshold. Not concentrated enough to trip the sustained threshold. Just a chronic low-grade leak of stalls that ground the kernel down until it froze at hour 30.
The fix is rcupdate.rcu_normal=1. This forces all RCU grace periods, including direct synchronize_rcu_expedited() calls, to use the asynchronous, non-blocking normal path. It doesn’t disable the calls. It demotes them: the kernel still processes the grace period, but without the synchronous CPU-interrupting expedited mechanism that causes the stalls.
Added to /boot/firmware/current/cmdline.txt:
... cgroup_enable=memory rcupdate.rcu_normal=1
After the next reboot with rcu_normal=1 active, expect zero rcu_preempt detected expedited stalls entries. The watchdog stays in place as a safety net (if a future kernel change reintroduces the problem, the watchdog catches it), but it should have nothing to do.
The Full Mitigation Stack
After all the work documented across this series, the defense-in-depth looks like this:
flowchart TD
    subgraph PREVENT[Prevention Layer]
        SSH_RSYNC[SSH rsync backup\ninstead of NFS]
        BWLIMIT["bwlimit=5000 on rsync\nno I/O saturation"]
        TOPOLOGY[topologySpreadConstraints\nCSI sidecars across both nodes]
        AFFINITY[requiredDuringScheduling\nmonitoring on Ultron]
        RCU_NORMAL["rcupdate.rcu_normal=1\ndemote all expedited RCU paths"]
    end
    subgraph DETECT[Detection Layer]
        PROM_ALERTS[PrometheusRule\nNodeUnexpectedReboot\nLocalPathBackupFailed]
        RCU_WD[rcu-stall-watchdog.service\ndual-path, checks every 2 min]
    end
    subgraph RECOVER[Recovery Layer]
        HUNG_TASK[hung_task_panic=1\nauto-reboot on D-state hang]
        HW_WD[Hardware watchdog\n30s systemd pet]
        RCU_REBOOT[Controlled systemctl reboot\nbefore network blackout]
        EXECSTARTPRE[ExecStartPre sandbox cleanup\nauto-cleanup on k3s start]
    end
    subgraph GITOPS[GitOps Layer]
        BOOTSTRAP[jarvis-node-bootstrap DaemonSet\nall host fixes in Git]
    end

    PREVENT --> DETECT
    DETECT --> RECOVER
    RECOVER --> GITOPS

    SSH_RSYNC -->|eliminates NFS hang triggers| RECOVER
    TOPOLOGY -->|reduces veth churn on Jarvis| DETECT
    RCU_NORMAL -->|eliminates expedited stalls at source| DETECT
    RCU_WD -->|detects cascade early| RCU_REBOOT
    RCU_REBOOT -->|2 min recovery| EXECSTARTPRE
    EXECSTARTPRE -->|cleans sandbox leaks| RECOVER
    BOOTSTRAP -->|redeploys all host fixes on pod start| RECOVER
Each layer addresses a different failure mode:
| Layer | What it catches |
|---|---|
| SSH rsync | NFS-related D-state hangs (eliminates the trigger) |
--bwlimit | I/O saturation from backup jobs |
topologySpreadConstraints | Container churn concentration on Jarvis |
rcupdate.rcu_normal=1 | Expedited RCU stalls at the source (kernel parameter) |
hung_task_panic | D-state hangs from any cause (>120s in uninterruptible sleep) |
| Hardware watchdog | Complete kernel hangs where systemd can’t run |
| RCU stall watchdog | Network black-hole from sustained or burst RCU stall cascade |
ExecStartPre cleanup | Sandbox leaks after any unclean shutdown |
| Prometheus alerts | Human notification for any reboot event |
jarvis-node-bootstrap DaemonSet | All host-level fixes survive k3s reinstalls via GitOps |
The Bootstrap DaemonSet
Every fix in this series lived only on disk on Jarvis. The sandbox cleanup script, the RCU watchdog, the systemd drop-ins, the cmdline.txt kernel parameters. None of it was in Git. If k3s got reinstalled, or the OS got re-imaged, or someone ran systemctl reset-failed at the wrong moment, all of it would vanish silently. The cluster would go back to crashing every 2 days without any indication that mitigations had existed.
Takeaway #2 from the series is “GitOps is non-negotiable.” For months I was violating my own rule by keeping the most critical cluster fixes as imperative host-level changes.
The fix is jarvis-node-bootstrap: a DaemonSet in kube-system, pinned to Jarvis via nodeSelector: kubernetes.io/hostname: jarvis. It runs a privileged initContainer that uses nsenter --mount=/proc/1/ns/mnt to write files to the host filesystem and reload systemd.
Files deployed on every pod start:
/usr/local/bin/k3s-pre-start-cleanup.sh          sandbox cleanup (with bolt-DB wait)
/usr/local/bin/rcu-stall-watchdog.sh              dual-path watchdog
/etc/systemd/system/k3s.service.d/sandbox-cleanup.conf
/etc/systemd/system/rcu-stall-watchdog.service
/etc/systemd/system/rcu-stall-watchdog.timer
/boot/firmware/current/cmdline.txt                rcupdate.rcu_normal=1
The initContainer runs systemctl daemon-reload and systemctl enable --now rcu-stall-watchdog.timer on the host after deploying. A pause container (unprivileged, readOnlyRootFilesystem, minimal resources) keeps the pod in Running state as a health signal. If kubectl get pods -n kube-system doesn’t show the bootstrap pod, the host fixes haven’t been applied.
To push a change to any host-level fix: update the script in the DaemonSet YAML, bump the bootstrap.jarvis/config-version annotation in the pod template, commit and push. ArgoCD picks it up, the DaemonSet pod restarts, the initContainer re-runs with the new content. No SSH required.
This is version 6 of the DaemonSet. It started at v1 on April 3 with just the sandbox cleanup and watchdog scripts. Each subsequent incident added something: v3 added the bolt-DB timing fix, v5 added the dual-path watchdog and rcu_expedited=0, v6 replaced rcu_expedited=0 with rcu_normal=1.
What’s Still Open
The kernel bug is still there. The rcu_preempt stall issue in 6.17.0-1008-raspi is a known regression in the Raspberry Pi kernel for Ubuntu 25.10. rcupdate.rcu_normal=1 should eliminate the expedited stall events entirely by forcing all grace periods through the normal asynchronous path. The watchdog stays active as a safety net until the fix is confirmed across multiple boot cycles. When Ubuntu ships a patched linux-raspi kernel, both rcu_normal=1 and the watchdog get removed.
Ubuntu 25.10 goes EOL in July 2026. Both nodes need to migrate to 26.04 LTS. The upgrade process needs to be staggered: upgrade Ultron first (agent, lower blast radius), verify, then upgrade Jarvis. The 26.04 LTS kernel will almost certainly include a fix for the RCU stall regression.
Longhorn backup still has no off-node destination. The NFS backup target was removed, the daily snapshot runs locally, and the SSH rsync backup copies PVC data to Ultron. But Ultron and Jarvis are on the same LAN. If the LAN goes down, both backups are on equipment I can’t reach. A MinIO S3 backup target (either a local MinIO instance outside the cluster, or a cloud bucket) would give true off-node backup. This is on the list.
External reachability monitoring. The November 30 network black-hole lasted 2 hours because I discovered it manually. An external ping monitor (Uptime Kuma on a separate host, or a router cron job) that sends a notification if Jarvis is unreachable for >2 minutes would reduce detection time to under 5 minutes. The RCU watchdog handles internal detection; external detection is still human.
Takeaways from the Full Series
Kernel NFS mounts on a control-plane node are catastrophic. Replace them with userspace alternatives at the first opportunity.
GitOps is non-negotiable. An emergency fix that isn’t committed and pushed is not a fix. ArgoCD will revert it.
Stale containerd sandboxes are inevitable after unclean shutdowns. Automate the cleanup with
ExecStartPrein the k3s systemd service.RCU stalls escalate to network black-holes under sustained container churn. The watchdog pattern (measure the rate, trigger a controlled reboot at a threshold) works. 2 minutes of intentional downtime beats 2 hours of invisible dead services.
Layer your mitigations. No single fix caught everything. The combination of
hung_task_panic, hardware watchdog, RCU stall watchdog, sandbox cleanup, SSH rsync with bandwidth limiting, andrcu_normal=1covers the failure space. Each one was built because the previous set wasn’t enough.Encode host-level fixes in GitOps. A DaemonSet with a privileged initContainer can deploy systemd units, scripts, and kernel parameters to the host. If it’s not in Git, it doesn’t survive a reinstall. The bootstrap DaemonSet is the difference between “we fixed this months ago” and “why is this broken again.”
Build your monitoring dashboards in Git. Every Grafana dashboard committed as a ConfigMap, ArgoCD-managed. When the cluster gets rebuilt, everything comes back on the first sync.
Required affinity beats preferred affinity for critical workloads. Preferred sounds safer. It isn’t. The scheduler will make resource-destroying decisions when one node isn’t ready.
Tune your watchdog thresholds with real data. The first threshold (3 stalls/10min) was based on one outage and caused a 10-reboot loop. The current threshold (10 stalls, dual-path) is based on five months of incidents. Watchdogs that are too sensitive are worse than no watchdog at all.
The cluster is not perfect. The kernel bug is still there (though rcu_normal=1 should finally silence it). The backup situation could be better. The OS needs upgrading before summer. But right now, when Jarvis starts accumulating RCU stalls, it reboots itself, cleans up the sandbox leaks, and comes back online in under 3 minutes. Without anyone pressing a power button. And every fix that makes that possible lives in Git, deployed by a DaemonSet, surviving any reinstall.
That’s the self-healing cluster. It took five months and more outages than I’d like to count to get here.