Building a Self-Healing k3s Homelab (Part 1): Foundation
Over the past few years I’ve been accumulating Raspberry Pis and single-board computers like some people accumulate unfinished side projects. It started back in school in France: breaking Linux installations, running a Pi-hole server, building a Magic Mirror. The nice thing about Pis is they’re small enough to throw in a bag. Through multiple moves and transatlantic travel they came with me, always finding some new use. Now I’ve finally settled in Calgary, and I have a pile of these devices sitting around.
I’ve been working with EKS and AKS professionally, so Kubernetes isn’t new to me. My k8s journey started in 2021 with Kelsey Hightower’s Kubernetes The Hard Way, and since then I’ve been hands-on with managed clusters at work. But managed clusters abstract away all the interesting parts. The control plane is someone else’s problem. Networking is someone else’s problem. Storage is someone else’s problem. I wanted those problems. Calgary turned out to be the right place for this. Microsoft’s local office runs regular meetups and workshops around Kubernetes, which kept the motivation going. I figured: I have the hardware. I have the background. I should build a real cluster at home. Not a single-node toy, not another managed service, but a proper multi-node cluster with GitOps, distributed storage, monitoring, and the ability to survive a node going down. Something I could run my home automation stack on (Home Assistant, ESPHome, Matter, Mosquitto, Music Assistant) and also use as a platform to experiment with things I’d never get to touch in a managed environment.
This is the story of building that cluster. I’ll document everything, including all the ways it broke, which turned out to be more educational than anything I planned. This is Part 1: the hardware and the foundation (k3s, networking, GitOps, and storage). The fun stuff (outages, kernel panics, debugging sessions at 6am) comes later.
The Hardware
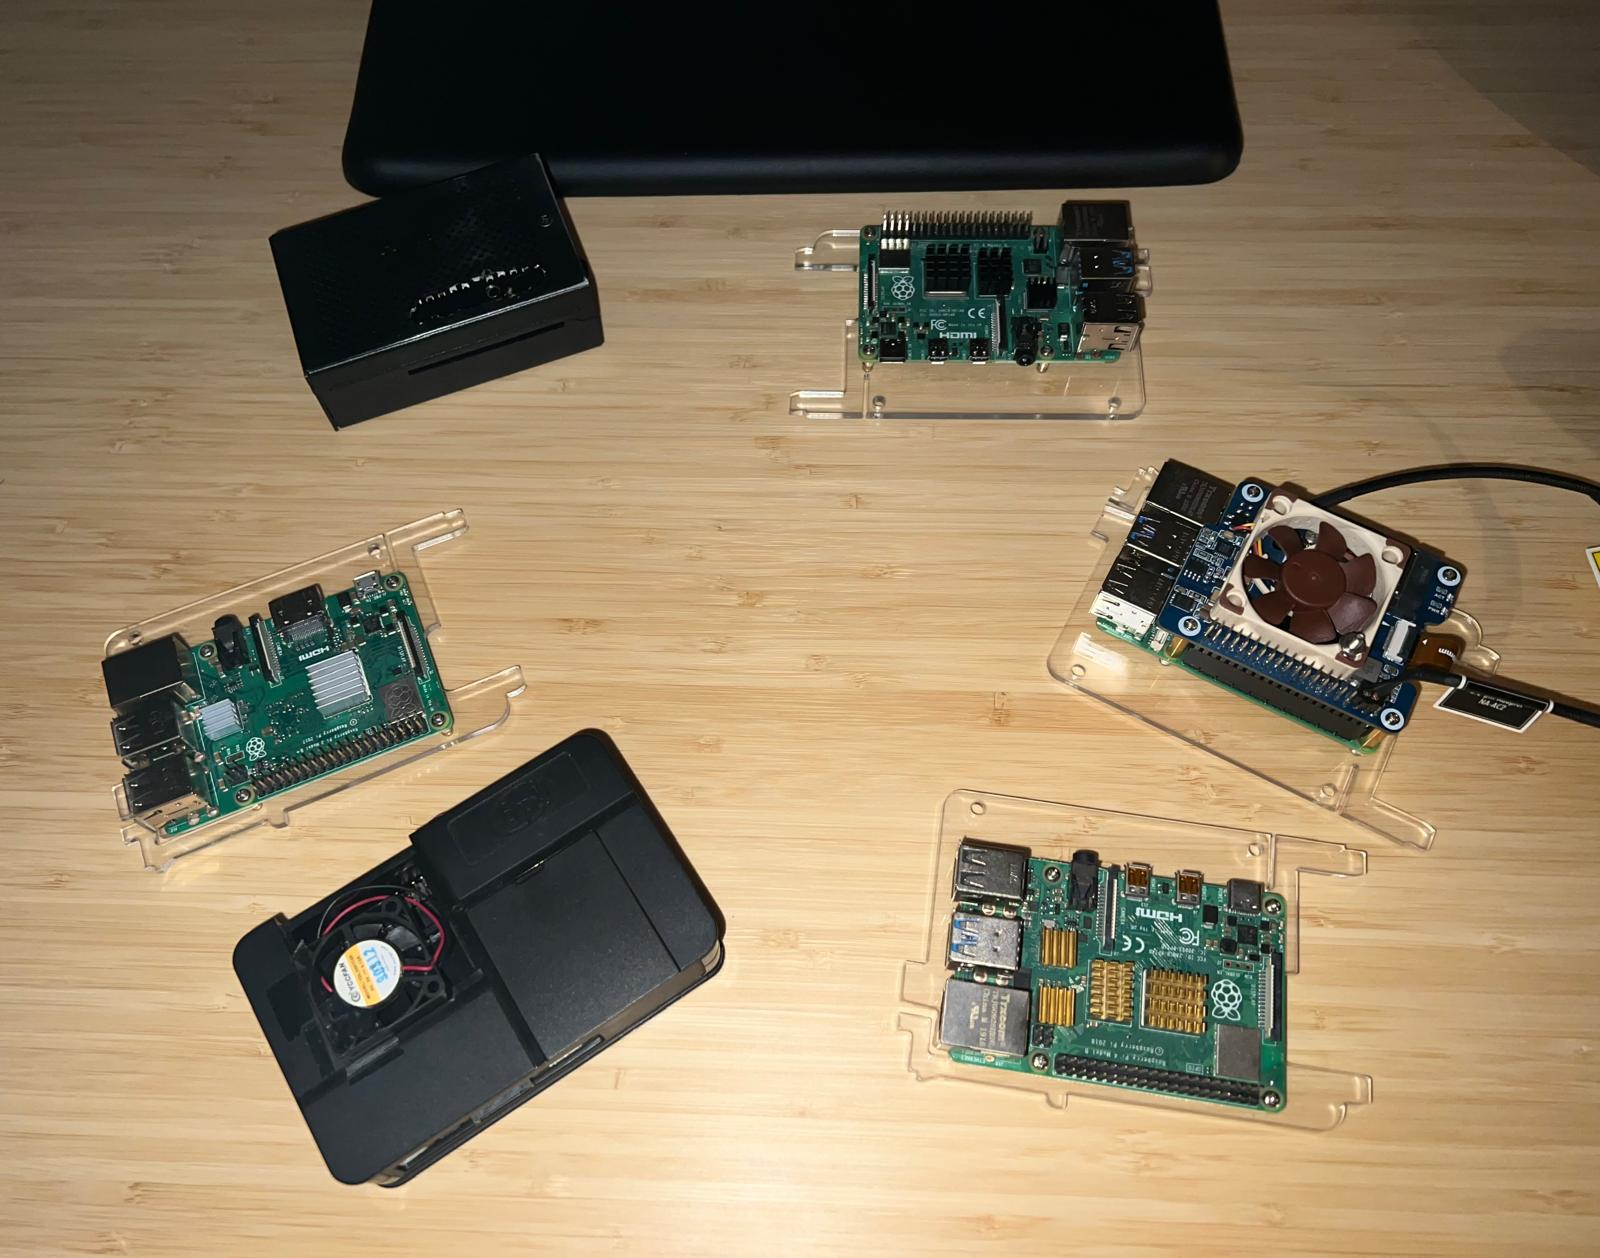
Two Raspberry Pis. I’m a huge comic fan, grew up on the stuff. I also have this chronic inability to name things. Servers, variables, projects, doesn’t matter. I stare at the screen for way too long. So when I started this k3s project fresh off my annual MCU rewatch, the names wrote themselves. (The pile of other Pis will get their turn eventually.)
Jarvis is a Pi 5 with 8GB of RAM, running on a 1TB NVMe drive. This is the control-plane node: it runs the k3s server process, embedded etcd, the Kubernetes API server, and all the home automation workloads that need to stay on the local network (hostNetwork: true for mDNS, Bluetooth, IoT protocols). It sits at 10.0.1.10.
Ultron is a Pi 4 with 8GB of RAM, connected to a 460GB Crucial MX500 SSD over USB-SATA (3.0). This is the worker node. It runs the heavy analytics stack: Prometheus, Grafana, Gitea, PostgreSQL. It sits at 10.0.1.11.
Both run Ubuntu 25.10 (arm64, interim release, EOL July 2026; migration to 26.04 LTS is on the todo list). Both have 4-core ARM CPUs, though the Pi 5’s Cortex-A76 cores are meaningfully faster than the Pi 4’s Cortex-A72.
Physical network topology

LAN: 10.0.1.0/24
├── Router / NextDNS
├── Jarvis (Pi 5) — 10.0.1.10
│   ├── k3s server + embedded etcd
│   ├── Home Assistant (hostNetwork)
│   ├── Music Assistant, ESPHome, Matter, Mosquitto
│   ├── ArgoCD application-controller
│   └── NVMe 1TB
└── Ultron (Pi 4) — 10.0.1.11
    ├── k3s agent
    ├── Prometheus, Grafana
    ├── Gitea + PostgreSQL + Valkey
    └── USB-SATA SSD 460GB
k3s: Why Not Full Kubernetes
k3s is a lightweight Kubernetes distribution from Rancher. It’s the obvious choice for ARM homelab use. It ships with everything bundled: containerd as the runtime, Flannel as the CNI, CoreDNS, metrics-server, and Traefik as the ingress controller. You get a fully conformant Kubernetes cluster in a single binary. No kubeadm, no etcd management, no separate controller-manager dance.
The version I’m running is k3s v1.33. I chose embedded etcd (instead of the default SQLite backend) because I want this to eventually support HA control-plane, and SQLite does not.
Flannel handles pod networking with VXLAN encapsulation. Pod CIDR is 10.42.0.0/16, service CIDR is 10.43.0.0/16. Both nodes need to allow UDP 8472 (Flannel VXLAN) and TCP 10250 (kubelet) through their firewalls.
UFW is active on both nodes. Default policy is deny for incoming, allow for outgoing. I explicitly allowlist:
10.0.1.0/24for SSH, k3s API (6443), and application ports10.42.0.0/16and10.43.0.0/16for pod and service CIDRs8472/udpfor Flannel VXLANDEFAULT_FORWARD_POLICY="ACCEPT"for Flannel packet forwarding
One thing worth noting about UFW and k3s: the svclb DaemonSet (k3s’s service load balancer) SNATs cross-node pod-to-host traffic through the node’s LAN IP. So if you have a hostNetwork: true pod on Jarvis and it receives traffic from a Traefik pod running on Ultron, the source IP that shows up at the application level is 10.0.1.11, not a pod CIDR address. UFW rules need to account for that: allow the LAN range, not just pod CIDRs.
GitOps: Gitea + ArgoCD
Everything is GitOps. Every Kubernetes manifest, every Helm values file, every config change goes through a Git commit. No imperative kubectl apply in normal operations. This is enforced by ArgoCD with selfHeal: true and prune: true, which means the cluster will automatically reconcile to match what’s in Git, and will delete resources that aren’t in Git anymore.
The Git server is Gitea, running as a Kubernetes pod on Ultron. ArgoCD authenticates to Gitea via an HTTPS access token stored in 1Password, synced into the cluster as a Kubernetes Secret via the 1Password Operator.
ArgoCD manages 11 applications:
| App | Namespace | What it is |
|---|---|---|
home-assistant | home-assistant | HA + ESPHome + Matter + Mosquitto + Music Assistant |
home-assistant-manifests | home-assistant | CronJobs, PrometheusRules, NetworkPolicies for the HA stack |
longhorn | longhorn-system | Longhorn storage (Helm chart) |
monitoring | monitoring | Prometheus + Grafana + Alertmanager (kube-prometheus-stack Helm chart) |
infrastructure-manifests | various | StorageClasses, NetworkPolicies, Grafana dashboards |
esphome | home-assistant | ESPHome dashboard |
matter-server | home-assistant | Matter protocol server |
mosquitto | home-assistant | MQTT broker |
music-assistant | home-assistant | Music Assistant server |
samba | samba | SMB file share |
external-secrets | external-secrets | External Secrets Operator |
The ArgoCD control plane itself (server, repo-server, application-controller) is deployed via Helm and is NOT managed by an ArgoCD Application. I learned this the hard way: putting ArgoCD in charge of managing itself via the resources-finalizer.argocd.argoproj.io annotation on its own Application is a great way to accidentally wipe your entire GitOps control plane with one typo. More on that incident in Part 2.
ArgoCD is accessed at argocd.local via Traefik ingress. The ingress controller (Traefik) is the k3s built-in, managed via a HelmChartConfig CRD committed to the infrastructure-manifests application.
flowchart TD
    DEV[Developer / kubectl]
    GITEA[Gitea\n10.0.1.11\ngit.local]
    ARGOCD[ArgoCD\nargocd.local]
    K3S_API["k3s API Server\n10.0.1.10:6443"]
    CLUSTER[k3s Cluster\nJarvis + Ultron]

    DEV -->|git push| GITEA
    GITEA -->|webhook / poll| ARGOCD
    ARGOCD -->|watch + reconcile| K3S_API
    K3S_API -->|apply manifests| CLUSTER
    ARGOCD -->|selfHeal: prune| CLUSTER
Storage: Longhorn
For persistent storage I’m using Longhorn v1.11.0. It’s a cloud-native distributed storage system that runs entirely inside Kubernetes, uses iSCSI under the hood, and replicates volumes across multiple nodes.
With two nodes, I can have numberOfReplicas: 2, giving me actual redundancy: if one node goes down, the volume stays accessible through the other. For write-heavy workloads I use a longhorn-single-replica StorageClass (numberOfReplicas: 1) to halve the write amplification; these volumes are covered by daily snapshots and external backup anyway.
The default local-path provisioner (k3s built-in) handles volumes that don’t need replication: Home Assistant config, ESPHome config, Music Assistant data. These stay on Jarvis’s NVMe via local-path. The trade-off is that a local-path PVC is pinned to the node it was created on, which means any pod using it must also schedule to that node. This is a Recreate strategy implication: no rolling updates across nodes.
flowchart LR
    subgraph JARVIS["Jarvis - Pi 5"]
        LH_MGR_J[longhorn-manager]
        LH_CSI_J[longhorn-csi-plugin]
        NVMe["NVMe 1TB\n/var/lib/longhorn"]
    end
    subgraph ULTRON["Ultron - Pi 4"]
        LH_MGR_U[longhorn-manager]
        LH_CSI_U[longhorn-csi-plugin]
        SSD["USB-SATA SSD 460GB\n/var/lib/longhorn"]
    end
    subgraph CSI[CSI Sidecars]
        ATTACHER["csi-attacher x2"]
        PROV["csi-provisioner x2"]
        RESIZER["csi-resizer x2"]
        SNAP["csi-snapshotter x2"]
    end
    NVMe <-->|replica sync| SSD
    LH_MGR_J --- CSI
    LH_MGR_U --- CSI
Longhorn’s CSI sidecars (attacher, provisioner, resizer, snapshotter) run as Deployments. Each runs 2 replicas. Where those replicas land matters: I learned in the first outage that having all 8 CSI sidecar pods on one node concentrates all the container networking churn on that node. More on this in Part 3.
Monitoring: Prometheus + Grafana
The monitoring stack is kube-prometheus-stack deployed via ArgoCD, Helm values committed to argocd-apps.yaml. Prometheus runs on Ultron (8× CPU required affinity). Grafana runs on Ultron too, accessing Prometheus as a datasource within the cluster.
Node metrics come from node-exporter, which runs as a DaemonSet on both nodes with hostNetwork: true and hostPID: true. Longhorn has its own ServiceMonitor. ArgoCD has ServiceMonitors. CoreDNS metrics get scraped. Everything flows into Prometheus and lands in dashboards I built in Grafana (committed as ConfigMap resources with the dashboard JSON, fully GitOps managed).
One thing that took some tuning: Prometheus TSDB retention. The default is 10 days. On a Pi 4 with limited CPU, the TSDB compaction runs are expensive. I settled on 7 days after watching Ultron’s load average spike to 11 on a 4-core system during a compaction run. That’s a story for Part 2.
Prometheus is behind a required node affinity for Ultron. This is important: on a cold reboot, Ultron registers with the k3s API about 30 seconds after Jarvis. If the affinity is only preferred, the scheduler will happily land Prometheus on Jarvis before Ultron is ready, consuming ~700MB of RAM on the control-plane node. With required, it stays Pending for 30 seconds and then schedules correctly.
Security Posture
Security is not optional even in a homelab, especially one running Home Assistant with access to physical devices. The baseline:
Pod Security Standards: Every namespace is labeled with pod-security.kubernetes.io/enforce. Most get restricted; namespaces that genuinely need privilege (Longhorn, home automation with hostNetwork, monitoring node-exporter) get privileged for enforce but restricted for audit and warn. This means you get the security logging without breaking workloads that have legitimate reasons to be privileged.
Container hardening: All new workloads get:
securityContext:
  runAsNonRoot: true
  allowPrivilegeEscalation: false
  readOnlyRootFilesystem: true
  capabilities:
    drop: ["ALL"]
  seccompProfile:
    type: RuntimeDefault
Network policies: Default-deny in every namespace. Traffic is explicitly allowlisted: ArgoCD sync port (8080), Longhorn engine ports (9500-9504), Prometheus scrape paths. Every new namespace needs a NetworkPolicy before workloads go live.
External Secrets: Secrets are not committed to Git. They live in 1Password and are synced into the cluster via the External Secrets Operator using a ClusterSecretStore. This covers ArgoCD’s Gitea credentials, Grafana admin credentials, and any app-level secrets.
Resource Management
With 8GB of RAM per node and k3s server consuming ~1.5GB by itself on Jarvis, the budget is tight. Everything runs with resource requests and limits. No BestEffort pods in production. The target QoS classes:
- Guaranteed: k3s server, ArgoCD application-controller, Prometheus (memory-predictable, OOM-kill catastrophic)
- Burstable: Application workloads (Home Assistant, Gitea, Grafana, etc.). Requests set lower than limits
- BestEffort: Never
Initial state when I built this had almost everything at BestEffort (no requests, no limits). Getting everything to Burstable was a multi-session project. Getting Prometheus to Guaranteed took an OOM incident first.
Workload Placement
This is the most important architectural decision in a 2-node cluster. If you don’t tell the scheduler where things should go, it decides for you, and it will make choices that seem fine until a node reboots and the scheduler lands your 700MB Prometheus on the control-plane node because the worker isn’t ready yet.
The rules I settled on:
| Workload | Node | Why |
|---|---|---|
| Home Assistant | Jarvis (required) | hostNetwork for Bluetooth/mDNS, local-path PVC |
| ESPHome, Matter, Mosquitto | Jarvis (required) | hostNetwork for IoT protocol multicast |
| Music Assistant | Jarvis (preferred) | Shares home automation network namespace |
| ArgoCD application-controller | Jarvis (preferred) | API locality: watches every k8s resource constantly |
| Prometheus | Ultron (required) | Memory-heavy, must not starve Jarvis |
| Grafana | Ultron (required) | Longhorn RWO PVC; prevents volume attach race |
| Gitea + PostgreSQL + Valkey | Ultron (preferred) | Large DB, moves load off Jarvis |
| Longhorn managers | Both (DaemonSet) | Required for storage operations on each node |
required affinity means the pod stays Pending if the node isn’t available, which is correct. preferred allows fallback to the other node if the preferred one is down, which is what you want for workloads that can tolerate it.
The First Lesson: GitOps Is Not Optional
Before I internalized this properly, I would sometimes fix things with kubectl apply directly, update the Git file, and move on. What I discovered is that ArgoCD’s selfHeal: true means it will immediately revert any live change that doesn’t match the Git state. Within 20 seconds of a kubectl delete, ArgoCD recreates the resource from what’s in Gitea.
This is a feature, not a bug. It’s what makes GitOps reliable. But it means two things:
- An emergency
kubectlfix that isn’t immediately followed by agit add → commit → pushis not a fix. It’s a 20-second patch. - Editing the YAML file on disk and not running
kubectl apply -f argocd-apps.yaml -n argocdmeans the ArgoCD Application object in the cluster still has the old configuration. The file and the live object diverge silently.
I learned both of these lessons the hard way. The second one cost me a full session of debugging why my Prometheus retention change wasn’t taking effect. The first one cost me three outages in a single night.
Both stories are in Part 3.
What’s Next
In Part 2, I’ll cover the move from single-node to two-node, the ArgoCD Helm migration, the workload migration to Ultron, and the resource hardening work. Including the accidental cascade deletion of every ArgoCD Deployment at once.
Part 3 is where things get genuinely painful: the NFS backup story, which produced five outages in six days and eventually forced me to remove NFS from the cluster entirely.